"> "> CGM Archives - Living Diabetes

CGM Patterns That Predict Cardiovascular Risk: What Your Glucose Data Is Telling You

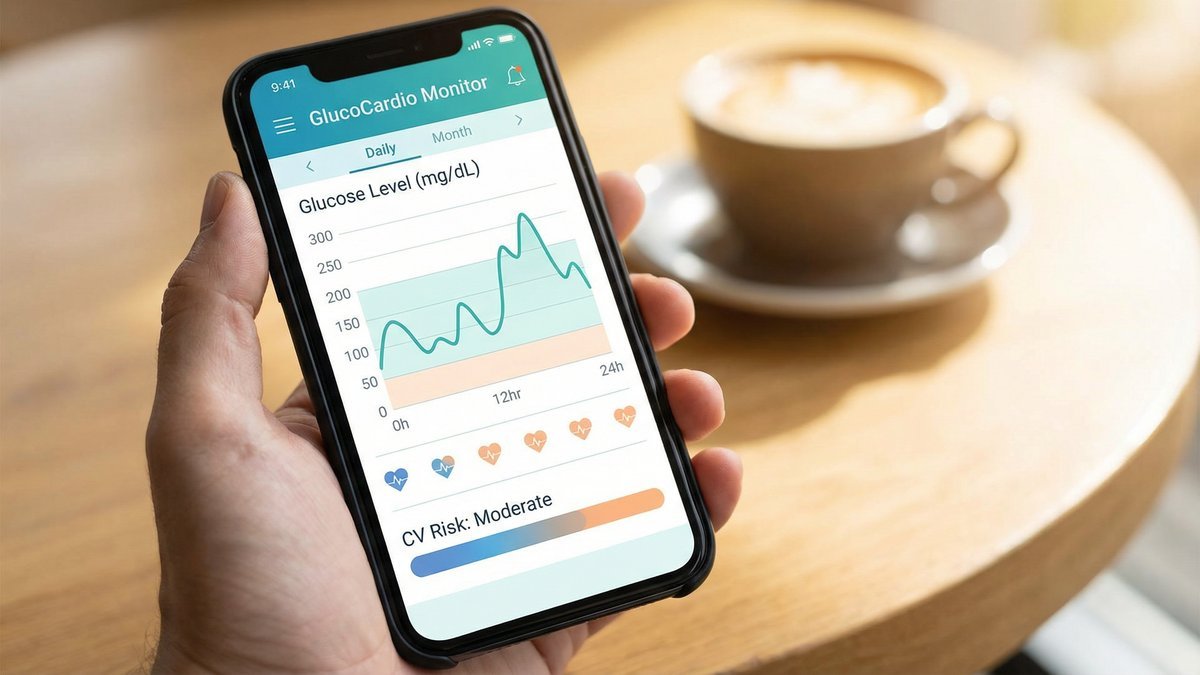
Your continuous glucose monitor does far more than track your blood sugar in real time. The patterns it reveals — the peaks, troughs, and variability between readings — are increasingly recognised as powerful predictors of cardiovascular risk. Understanding what your CGM data is telling you about your heart health could be one of the most important things you do this year.

Beyond HbA1c: Why Glucose Variability Matters

For decades, HbA1c was the primary metric used to assess long-term diabetes management. But HbA1c is an average — it tells you nothing about the peaks and troughs that occur throughout the day. Two people can have identical HbA1c values yet have very different glucose profiles, and very different cardiovascular risk.

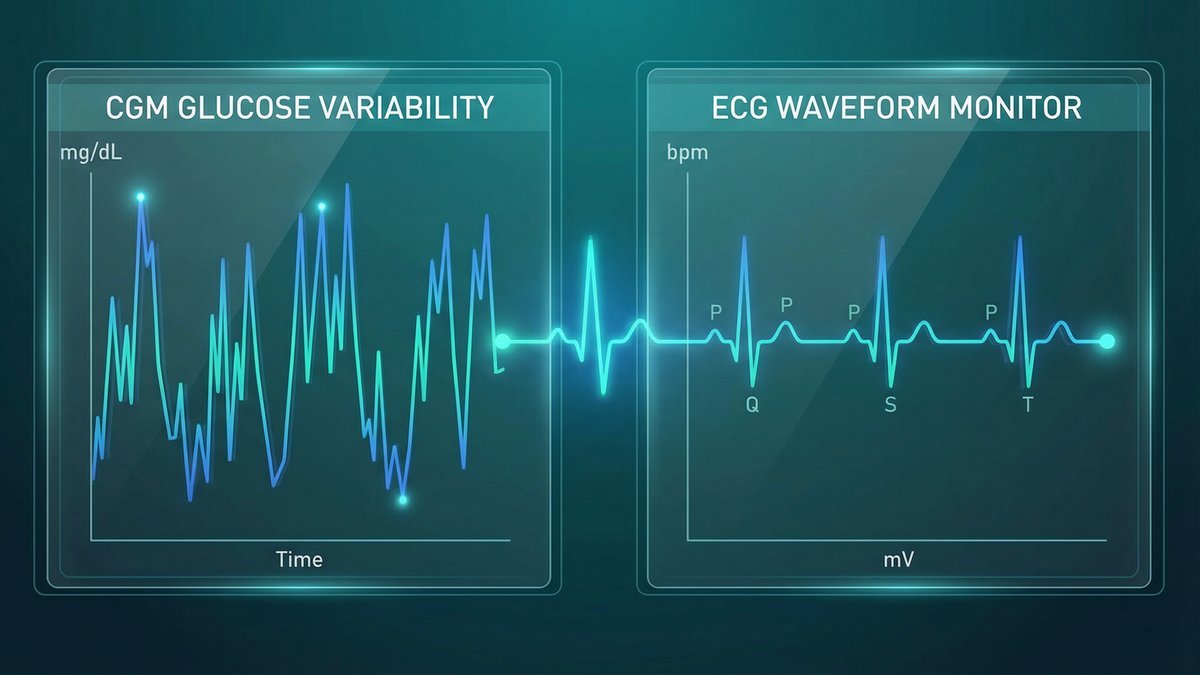
Research has consistently shown that glucose variability — the degree to which blood sugar fluctuates throughout the day — is an independent predictor of cardiovascular events, even after controlling for average glucose levels. CGM technology has made it possible to measure this variability with unprecedented precision.

Key CGM Metrics and Their Cardiovascular Significance

CGM MetricWhat It MeasuresCardiovascular Link
Time in Range (TIR)% of time glucose 3.9–10.0 mmol/LEach 10% increase in TIR associated with reduced CVD risk markers
CV% (Coefficient of Variation)Measure of glucose variabilityCV% >36% independently predicts cardiovascular events
Time Above Range (TAR)% of time glucose >10.0 mmol/LLinked to endothelial dysfunction and oxidative stress
Time Below Range (TBR)% of time glucose <3.9 mmol/LHypoglycaemia triggers adrenaline surge, increasing cardiac arrhythmia risk
Mean Amplitude of Glycaemic Excursions (MAGE)Magnitude of glucose swingsHigh MAGE associated with increased carotid intima-media thickness

Post-Meal Spikes: The Hidden Cardiovascular Danger

Post-prandial glucose spikes — the sharp rise in blood sugar after eating — are particularly damaging to the cardiovascular system. Each spike triggers a cascade of harmful effects: oxidative stress (free radical production), endothelial dysfunction (damage to the inner lining of blood vessels), and pro-inflammatory cytokine release. Over time, these repeated insults accelerate atherosclerosis.

⚠️ Warning Sign

If your CGM regularly shows glucose spikes above 10 mmol/L after meals, this is not just a blood sugar problem — it is a cardiovascular risk factor that warrants urgent attention and discussion with your diabetes team.

Nocturnal Hypoglycaemia: A Silent Cardiac Threat

One of the most valuable capabilities of CGM is detecting nocturnal hypoglycaemia — low blood sugar episodes during sleep that would otherwise go unnoticed. These episodes are not merely uncomfortable; they trigger a powerful sympathoadrenal response (adrenaline release) that can cause cardiac arrhythmias, including QT prolongation and ventricular tachycardia. In people with pre-existing cardiovascular disease, nocturnal hypoglycaemia is a recognised cause of sudden cardiac death.

How to Use Your CGM Data to Protect Your Heart

Maximising your CGM’s cardiovascular protective potential requires moving beyond simply watching the number on the screen. Review your ambulatory glucose profile (AGP) report regularly — most CGM apps generate this automatically. Look for patterns of high variability, frequent post-meal spikes, and any nocturnal lows. Share these reports with your diabetes team at every appointment.

✅ Target CGM Metrics for Cardiovascular Protection
  • Time in Range (3.9–10.0 mmol/L): >70%
  • Time Above Range (>10.0 mmol/L): <25%
  • Time Below Range (<3.9 mmol/L): <4%
  • Coefficient of Variation (CV%): <36%
💡 Key Takeaway

Your CGM is a window into your cardiovascular health, not just your blood sugar. High glucose variability, frequent post-meal spikes, and nocturnal hypoglycaemia are all independent cardiovascular risk factors. Use your AGP report, aim for Time in Range above 70%, and discuss your CGM patterns with your diabetes team at every appointment.


Related articles

How CGM Data Can Reveal Your Cardiovascular Risk

Continuous glucose monitoring (CGM) has transformed diabetes management by providing real-time glucose data that finger-prick testing cannot match. Beyond its immediate utility for dosing decisions, emerging research suggests that CGM-derived metrics — particularly glucose variability — may be powerful predictors of cardiovascular risk, offering insights that HbA1c alone cannot provide.

Beyond HbA1c: Why Glucose Variability Matters

HbA1c reflects average blood glucose over approximately three months, but it tells us nothing about the peaks and troughs that occur throughout the day. Two people with identical HbA1c values of 7% can have very different glucose profiles: one may have consistently stable glucose in the 6–8 mmol/L range, while the other oscillates between 3 and 15 mmol/L multiple times daily.

Research increasingly shows that this glucose variability — independent of average glucose — is associated with oxidative stress, endothelial dysfunction, and cardiovascular events. Each glucose spike triggers a burst of reactive oxygen species that damages the arterial endothelium, promotes inflammation, and activates coagulation pathways. The cumulative effect of repeated glucose excursions may explain why some people with “well-controlled” HbA1c still develop cardiovascular complications.

Key CGM Metrics and Their Cardiovascular Significance

CGM MetricDefinitionTargetCV Significance
Time in Range (TIR)% time between 3.9–10 mmol/L>70%Higher TIR associated with lower CV risk markers
Coefficient of Variation (CV)Measure of glucose variability<36%High CV linked to oxidative stress and endothelial damage
Time Above Range (TAR)% time above 10 mmol/L<25%Post-meal spikes drive inflammation and arterial stiffness
Time Below Range (TBR)% time below 3.9 mmol/L<4%Hypoglycaemia triggers arrhythmias and sympathetic activation
✅ Using CGM Data to Protect Your Heart
  • Review your AGP (Ambulatory Glucose Profile) report with your diabetes team at each appointment
  • Identify patterns of post-meal spikes and work on meal composition to reduce them
  • Aim for Time in Range above 70% as a primary management target
  • Address nocturnal hypoglycaemia — it triggers cortisol and adrenaline surges that stress the heart
  • Use CGM data to optimise exercise timing and intensity for minimal glucose disruption
💡 Key Takeaway

CGM provides a window into glucose dynamics that HbA1c cannot. Glucose variability — the peaks and troughs throughout the day — is an emerging cardiovascular risk factor in its own right. Focusing on Time in Range, reducing post-meal spikes, and eliminating hypoglycaemia are strategies that benefit both short-term glucose management and long-term cardiovascular health.


Related articles

Cardio Workouts That Won’t Cause Hypos: A Safe Exercise Guide for Diabetes

Exercise is one of the most powerful tools for managing diabetes and protecting cardiovascular health. Yet for many people with diabetes — particularly those on insulin or sulfonylureas — the fear of hypoglycaemia during or after exercise is a genuine barrier to physical activity. Understanding how different types of exercise affect blood glucose allows you to train safely and confidently.

How Exercise Affects Blood Glucose

The relationship between exercise and blood glucose is complex and depends on the type, intensity, and duration of activity. Aerobic exercise (moderate-intensity, sustained cardio) generally lowers blood glucose by increasing glucose uptake in muscle cells — an insulin-independent process mediated by GLUT4 transporters. This effect can persist for 24–48 hours after exercise, increasing the risk of delayed hypoglycaemia.

High-intensity interval training (HIIT) and resistance training can actually cause a transient rise in blood glucose due to the release of counter-regulatory hormones (adrenaline, cortisol, glucagon) that stimulate hepatic glucose production. This makes them potentially safer for those prone to exercise-induced hypoglycaemia.

The Safest Cardio Approaches for People with Diabetes

Exercise TypeGlucose EffectHypo RiskBest For
Brisk walkingGradual decreaseLow–moderateBeginners, daily activity
SwimmingGradual decreaseModerateJoint problems, all-body cardio
Cycling (steady)Gradual decreaseModerateCardiovascular fitness
HIITInitial rise, then fallLower during; higher afterTime-efficient, insulin users
Resistance trainingInitial riseLow during sessionMuscle preservation, insulin sensitivity
⚠️ Hypo Prevention Strategies
  • Check blood glucose before exercise: aim for 7–10 mmol/L (126–180 mg/dL) before starting
  • If below 5 mmol/L (90 mg/dL), have 15–30g of fast-acting carbohydrates before exercising
  • Reduce basal insulin by 20–50% for prolonged aerobic exercise (discuss with your team)
  • Carry fast-acting glucose (glucose tablets, gel) during every session
  • Check blood glucose after exercise and before bed — delayed hypos are common
  • Use a CGM if available — real-time glucose data transforms exercise safety

A Practical 4-Week Cardio Starter Plan

Week 1–2: 3 × 20-minute brisk walks per week. Check glucose before and after each session. Note your glucose response pattern.

Week 3–4: Increase to 4 × 30-minute sessions. Consider adding 5-minute HIIT intervals (30 seconds fast, 90 seconds recovery) to reduce hypo risk during longer sessions.

Ongoing: Work towards 150 minutes of moderate aerobic activity per week, as recommended by the ADA. Add 2 resistance training sessions per week for optimal metabolic benefit.

💡 Key Takeaway

Exercise is safe and highly beneficial for people with diabetes when approached with the right preparation. Understanding how different exercise types affect your blood glucose, checking levels before and after activity, and carrying fast-acting glucose are the foundations of safe exercise. Start gradually, monitor your response, and build confidence over time.


Related articles